

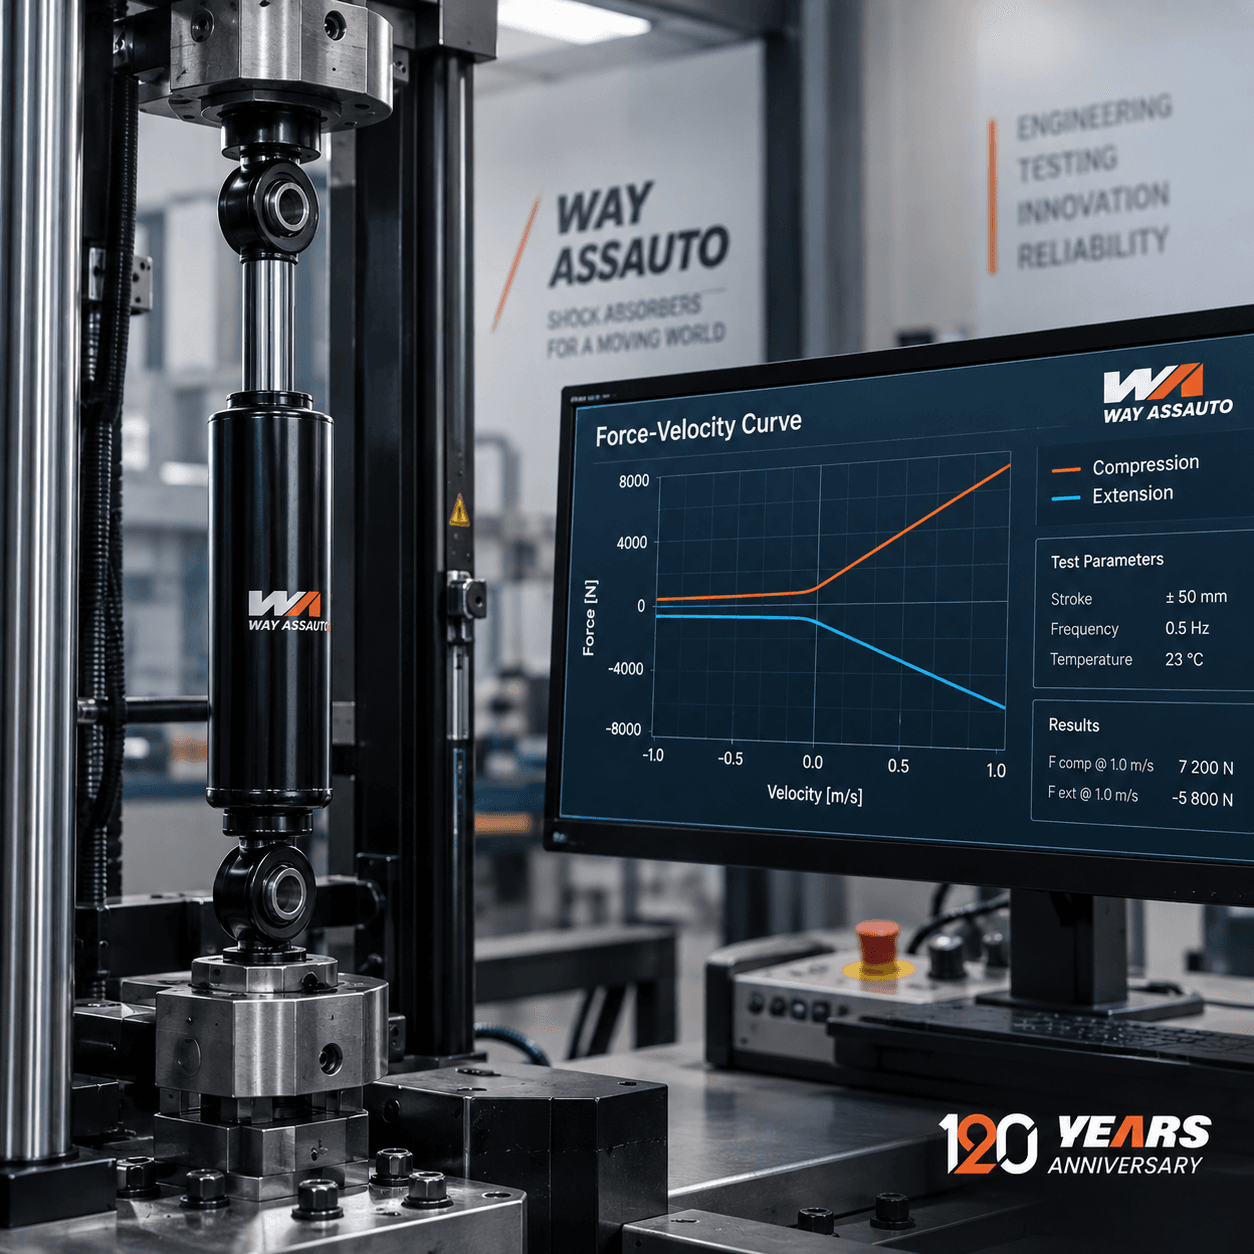
Force-velocity curve of a shock absorber: how to read it and what it indicates
The force-velocity curve of a shock absorber represents the relationship between the speed of movement of the stem and the damping force developed by the component during compression and extension.
It is one of the tools used during development and testing to analyze the shock absorber calibration and compare its behavior in different test conditions.
Reading this graph correctly also helps to understand why two apparently similar shock absorbers can have different responses. Dimensions, connections and external shape, in fact, are not sufficient to describe the dynamic behavior of the component.
What is rod speed?
The first element to clarify concerns the meaning of speed.
In the force-velocity curve the speed of the vehicle is not directly represented, but the speed with which the shock absorber rod moves with respect to the body.
This depends on the relative movement of the elements connected through the suspension system.
Irregularities in the road, load variations, braking, acceleration and changes in attitude can generate shock absorber movements with different speeds and amplitudes.
For this reason Vehicle speed and rod speed should not be confused.
A vehicle traveling slowly over a pronounced irregularity can, for example, generate a rapid movement of the shock absorber. In contrast, a vehicle traveling faster on a smooth surface can produce relatively small stalk movements.
Force-velocity curve of a shock absorber: how to read it?
The graph generally presents two fundamental quantities:
- the speed of the rod is represented on the horizontal axis;
- the force developed by the shock absorber is represented on the vertical axis.
The units of measurement may vary depending on the test system and the representation used.
The graph also distinguishes the behavior in compression and in extension, also called rebound.
The arrangement of the two areas with respect to the axes can change based on the convention adopted by the test bench or the software. Before interpreting a curve it is therefore essential to check the legend, signs and units of measurement.
As the rod speed increases, the damping force can vary differently depending on the internal design of the shock absorber.
Compression and extension: what changes?
During the compression, the rod enters the shock absorber body. The movement of fluid through the piston, passages and valves generates the damping force.
During the’extensionInstead, the stem moves in the opposite direction and the hydraulic circuit controls the return of the suspension.
Compression and extension do not necessarily have to develop the same force at the same stem speed.
The relationship between the two depends on the calibration defined for the shock absorber and, above all, on the application for which it is intended.
There is therefore no ideal curve valid for any vehicle.
A shock absorber intended for a truck, industrial vehicle cab, bus or railway application may require different damping characteristics. The Way Assauto website itself underlines how the characteristics of the application and the suspension configuration may require different behaviours.
Low and high rod speed
In the analysis of force-velocity curve of a shock absorber we often speak of the low and high speed zone of the rod.
The distinction always concerns the speed of movement of the shock absorber and not the speed indicated by the speedometer.
In general terms, relatively slow movements of the rod can be associated with progressive changes in vehicle attitude. Faster movements can instead occur when the suspension encounters more abrupt stresses, such as certain irregularities or discontinuities in the surface.
However, these associations must be considered indicative.
The actual movement of the shock absorber depends on the dynamics of the vehicle, the kinematics of the suspension and the stress characteristics.
Linear, progressive or digressive curve
The shape of the graph allows you to observe how the damping force changes as the speed of the rod varies.
In simplified terms, different behaviors can be encountered.
In a reply basically linear, the force increases in a relatively proportional manner to the increase in speed.
In a reply progressive, the increase in force becomes more marked as the speed of the rod increases.
In a reply digressive, however, the force can increase rapidly in the first part of the curve and subsequently grow with a lower slope.
These definitions help describe the shape of the response, but do not by themselves allow us to establish whether one shock absorber is better than another.
The curve must be interpreted in relation to:
- application;
- mass and loads;
- suspension geometry;
- operating conditions;
- vehicle characteristics;
- comfort and control objectives;
- specifications defined during the project phase.
Why can two similar shock absorbers have different curves?
This is a passage I would absolutely add to the article.
Two shock absorbers can have very similar external dimensions and attachments, but develop different forces at the same rod speeds.
In fact, the behavior also depends on the internal configuration of the component.
Elements that can influence the response include:
- piston;
- valve system;
- fluid passages;
- characteristics of the fluid;
- internal configuration;
- internal pressure, when expected;
- component geometry;
- overall calibration.
For this reason, dimensional compatibility is not sufficient to establish that two shock absorbers have the same dynamic behavior.
Way Assauto also highlights in its technical contents how two apparently similar components can have different damping curves, internal pressures and calibrations.
How is the force-velocity curve detected?
To get one force-velocity curve of a shock absorber, the component is subjected to a controlled test through a dedicated bench.
The system imposes certain movements on the shock absorber and measures the forces developed.
Depending on the type of test and the objective of the analysis, different parameters and operating conditions can be considered.
The results allow, for example, to:
- analyze compression behavior;
- analyze extension behavior;
- compare different configurations;
- verify consistency with the project parameters;
- evaluate the repeatability of the behavior;
- identify any anomalies;
- compare different calibrations.
However, a single curve must not be interpreted without knowing the conditions under which it was obtained.
Why are temperature and test conditions important?
This point would also make the article more technical.
The response of the shock absorber can be influenced by the conditions in which the test is performed.
To correctly interpret the results it is therefore important to know parameters such as temperature, test mode, stroke and initial conditions of the component.
Comparing two graphs obtained with different procedures or conditions can lead to incorrect conclusions.
For this reason the force-velocity curve of a shock absorber must be read together with the information relating to the test.
What allows us to really understand the curve?
The curve is not simply used to check how much "resistance" a shock absorber offers.
It allows you to observe how the damping force varies in relation to the speed of movement.
This makes it possible to analyze the response of the component in different operating zones and compare it with that expected during development.
Higher force also does not automatically mean a better shock absorber.
A component that is excessively braked for a given application may not provide the desired response, just as insufficient damping may not adequately control movements.
The objective of the calibration is therefore to obtain behavior consistent with the system in which the shock absorber will have to work.
Design, calibration and testing of Way Assauto shock absorbers
The force-velocity curve of a shock absorber it therefore represents one of the tools through which it is possible to transform the behavior of the component into measurable and comparable data.
Way Assauto develops damping solutions for different applications, including trucks, trailers, buses, automotive and railway sectors. The company website describes a development process that includes design, prototyping and testing through test benches, vibration tests, road tests and comparative analyses.
The analysis of the data obtained during the tests allows the real behavior of the component to be compared with the objectives defined during development.
In this context, the force-velocity curve is not just a graph: it is a representation of the way the damper reacts to movement and a useful tool for design, calibration, verification and performance comparison.
Leave a Reply